
{{ heroLine1 }}
{{ heroLine2 }}
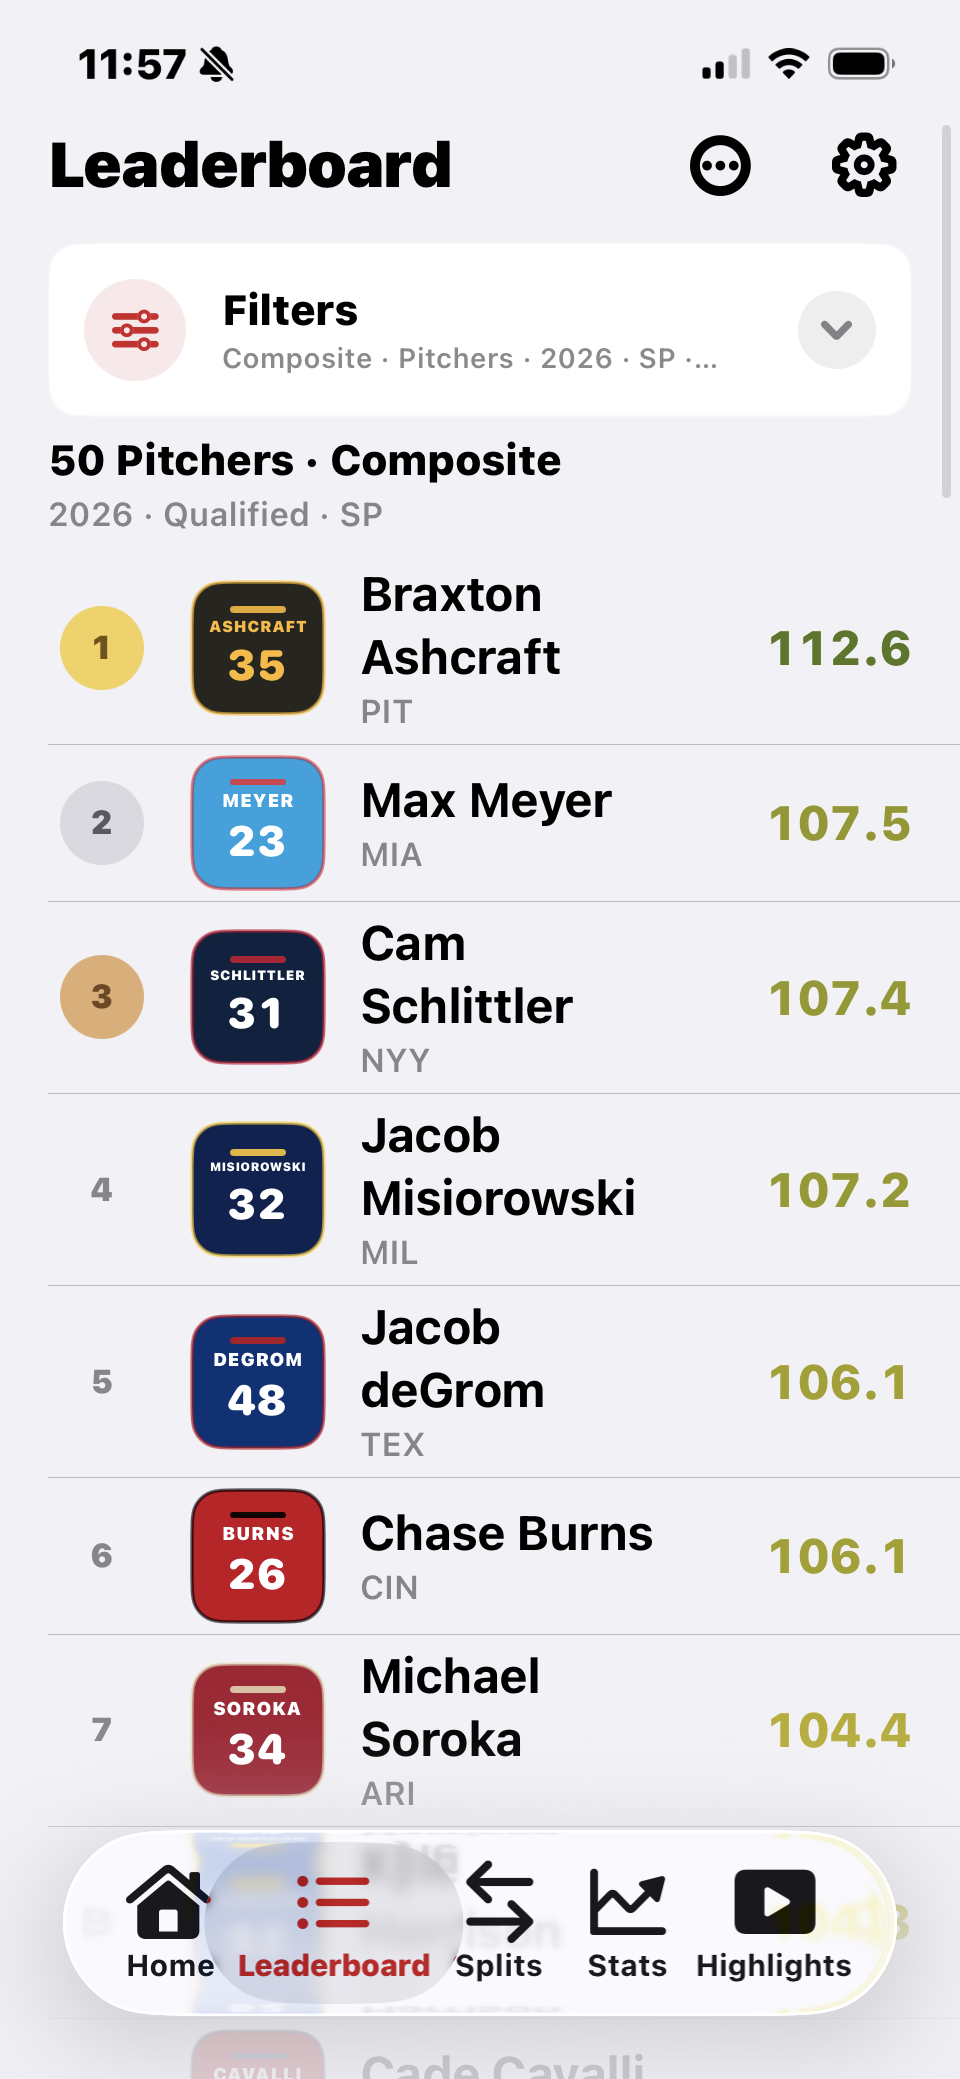
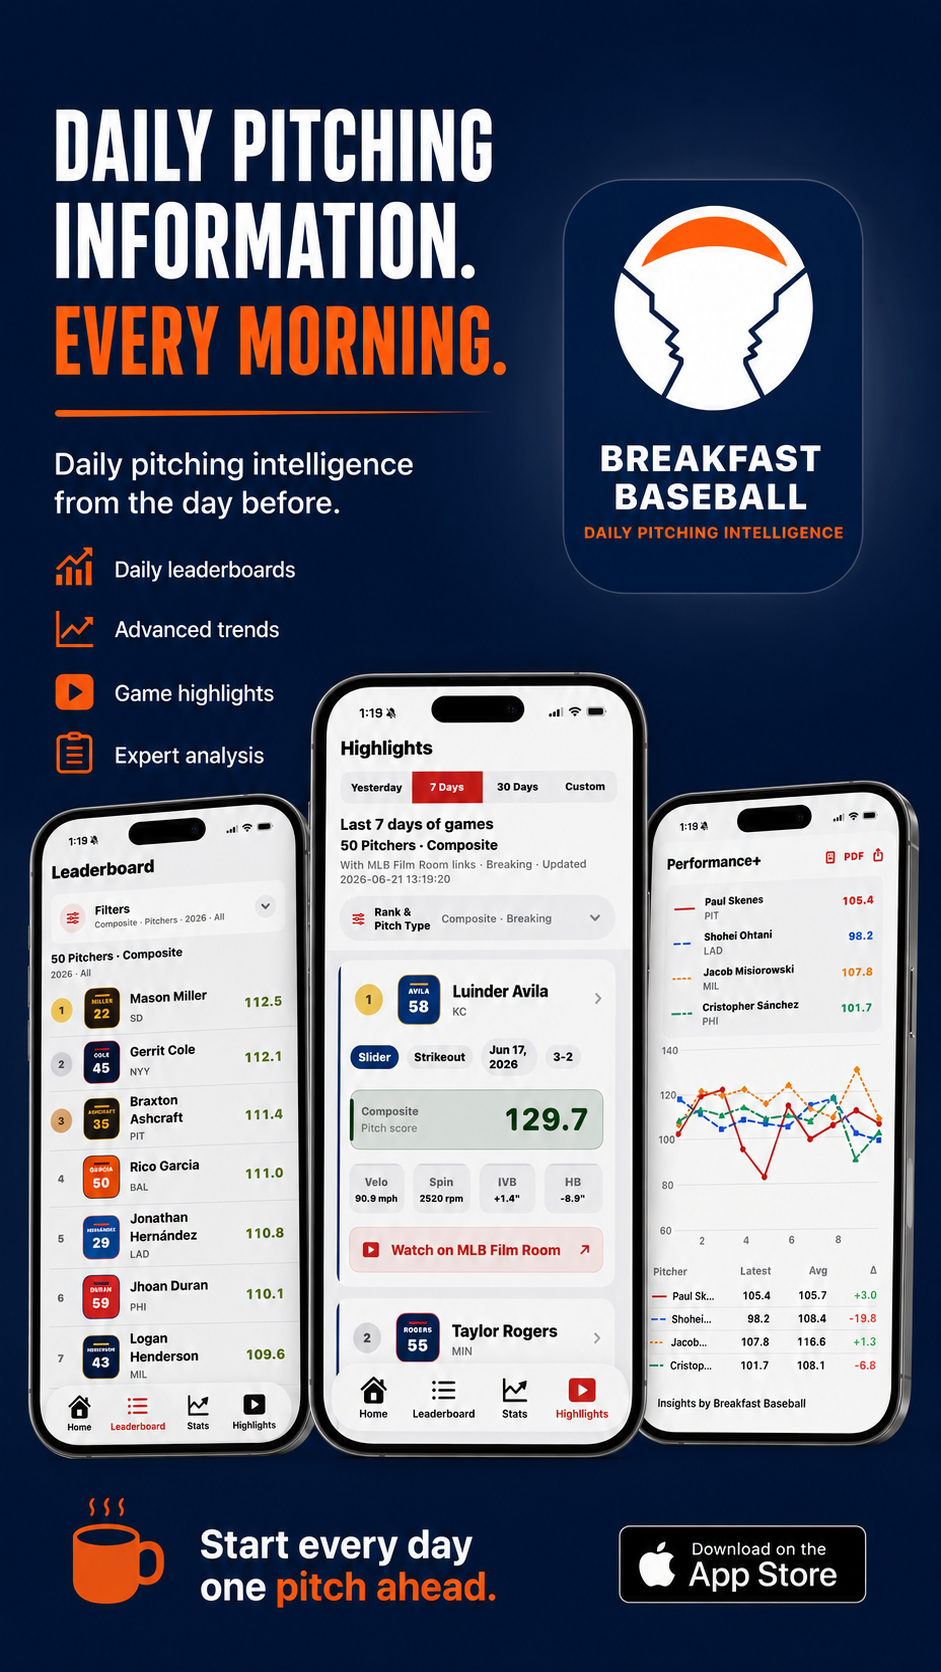
Breakfast Baseball turns raw pitching data into simple scores — Stuff+, Command+, Performance+ and more — so you can read any arm in one number. Scaled so 100 = league average.
What is
Breakfast
Baseball?
Breakfast Baseball started from a simple habit: checking the previous night's pitching before the day got busy. Box scores tell you what happened — not whether a good outing came from real pitch quality, sharp location, a usage change, or a lucky stretch, or whether a bad line hid underlying improvement.
It was built to answer those questions in one place, on your phone, without needing to know advanced statistics. Most baseball apps give you either raw data — velocity, spin, percentiles — or a single number borrowed from somewhere else.
Breakfast Baseball sits in the middle: a custom pitching model built for this app, designed to be read quickly and compared fairly.
100 is average.
Everything reads
from there.
Every Breakfast Baseball score is calibrated to a pitcher's role. No percentile math, no raw data columns to decode — just one number and a color.
Five scores that
tell the whole story
Great stuff with poor results — or the reverse — is where the interesting analysis lives. Read them together.
Composite Score
THE HEADLINE NUMBERA single overall grade blending results, pitch quality, and command. Your quick comparison tool — the starting point, not the whole story.
Stuff+
Physical pitch traits — velocity, movement, spin, shape vs. peers. How nasty does the arsenal look on paper?
Predictive Stuff+
Stuff+ with extra weight on high-leverage pitches — late counts, close games, runners on. What shows up when it matters.
Command+
Location quality — working the edges, avoiding middle-middle, executing the plan pitch after pitch.
Performance+
Actual batter outcomes — strikeouts, walks, contact quality, damage allowed — all situation-weighted. How has he actually been getting outs?
Plus durability scores — Health, Availability, and Consistency — track who stays on the mound. See all nine →
Five tabs. One morning routine.
{{ tab.title }}
{{ tab.body }}
See it in action
From first pitch to your coffee
Games update each morning
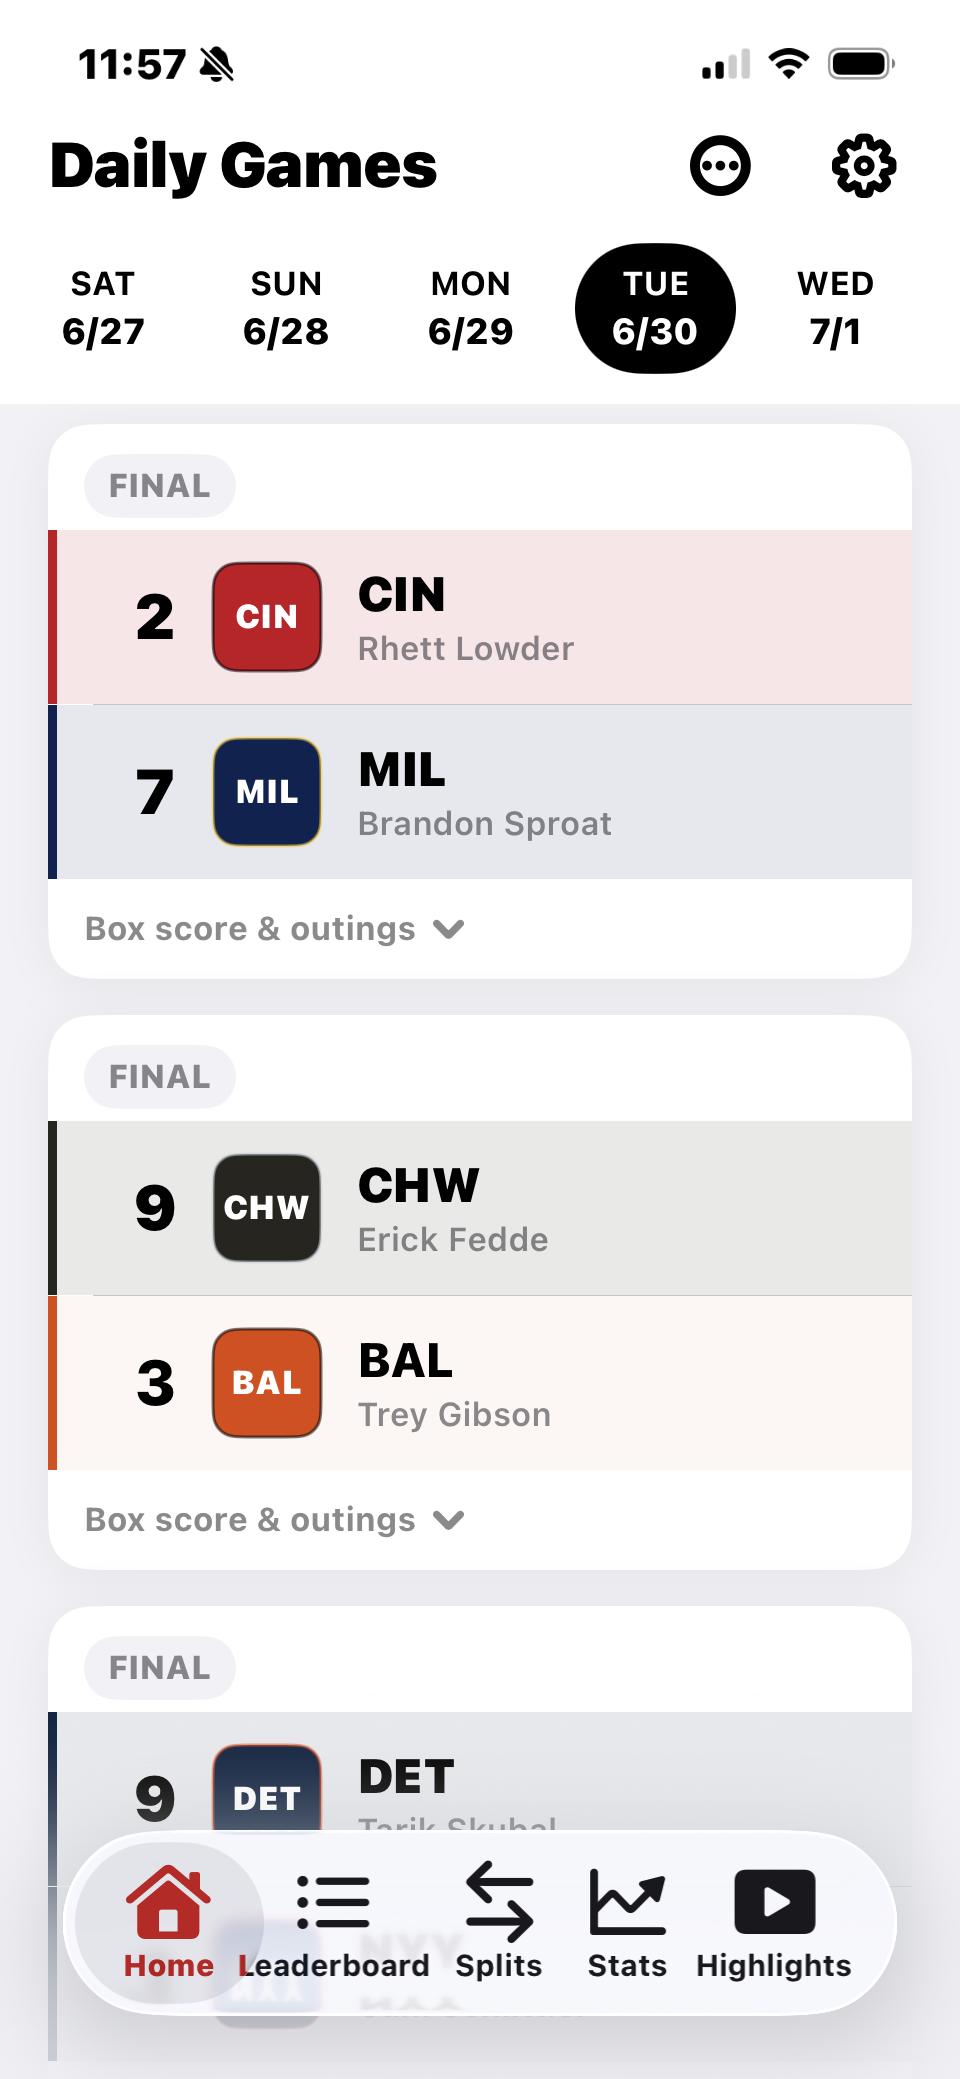
An automated pipeline processes every pitch from the night's games right after they finish — usually ready by 9AM ET.
Custom scores rank every pitcher
Pitch-level inputs become Composite, Stuff+, Command+ and Performance+ — computed per outing, scaled so 100 is average.
Dig deeper with trends & splits
Chart any metric outing-by-outing, compare arms head-to-head, and read auto-generated Insight Reports on every pitcher.
Built for how you
follow the game
Coffee and a quick read
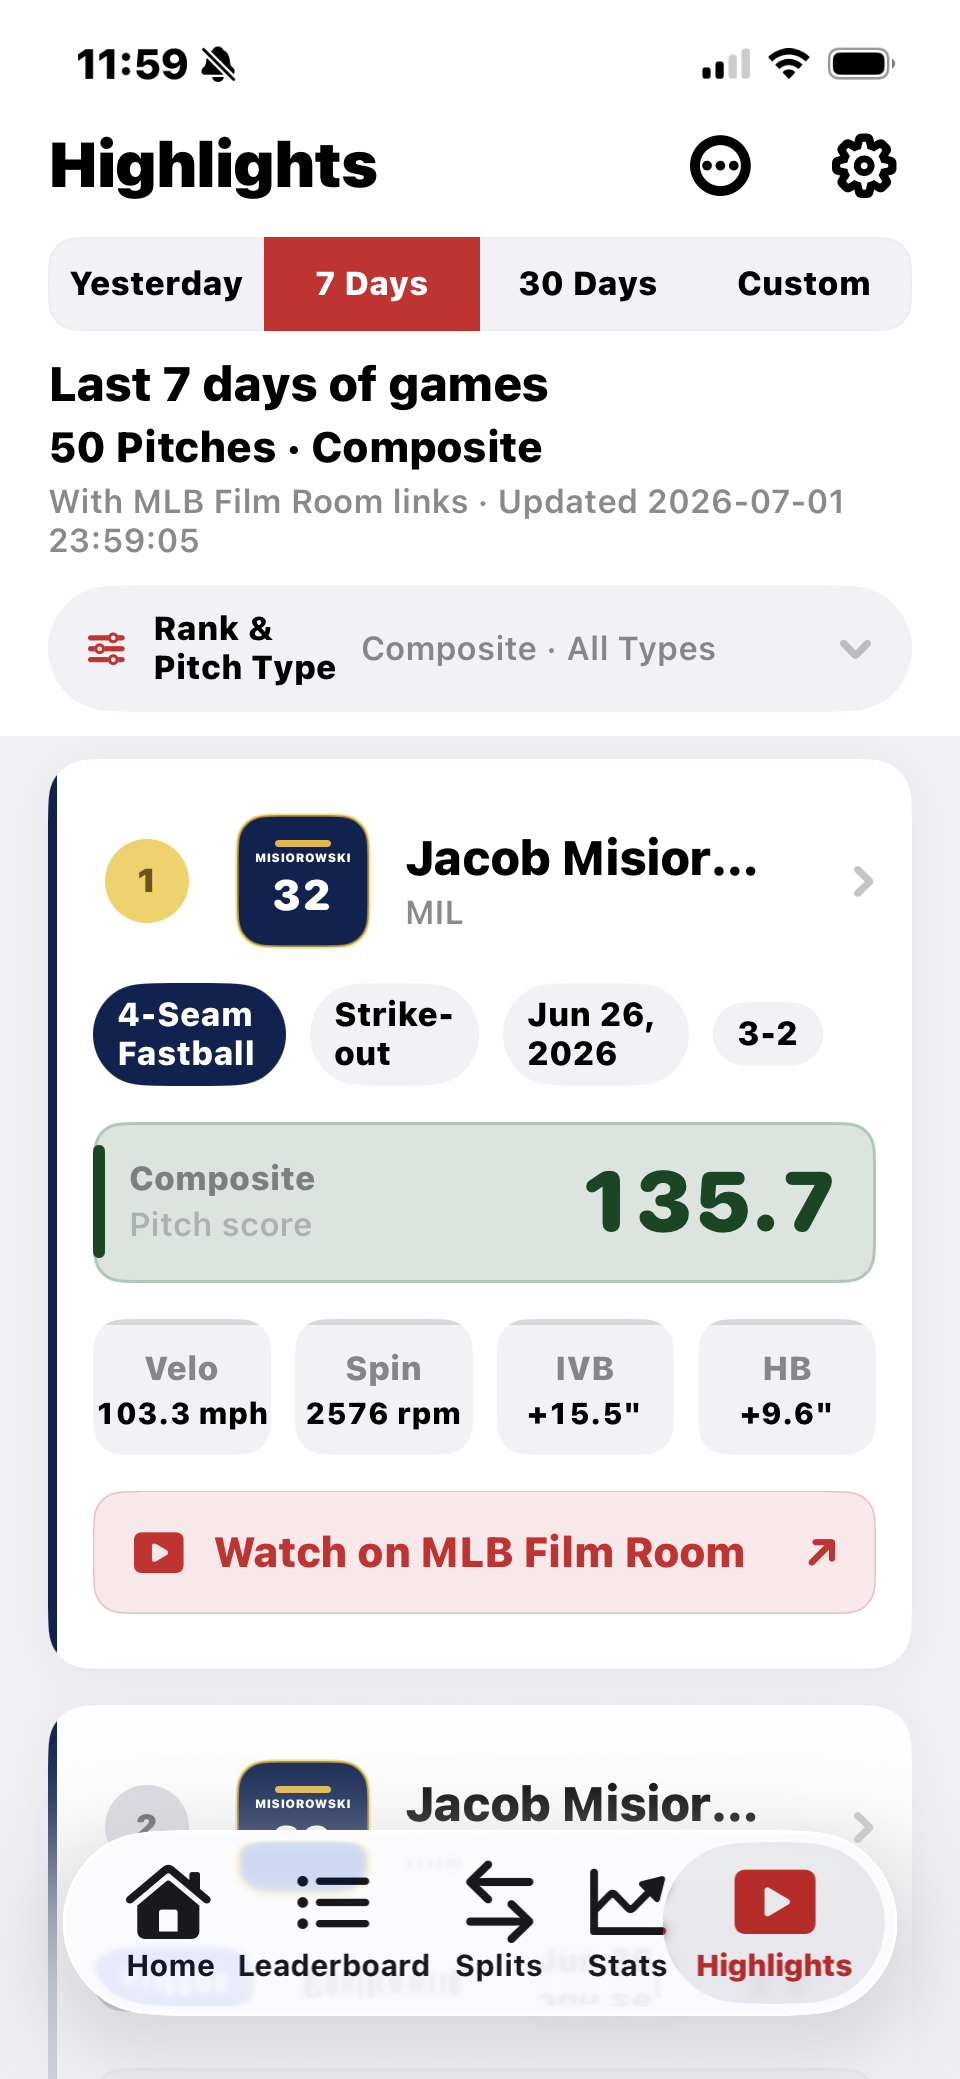
Open the app with your coffee and see who pitched well last night — and why the model liked (or didn't like) the outing — without digging through five different sites.
Spot the movers early
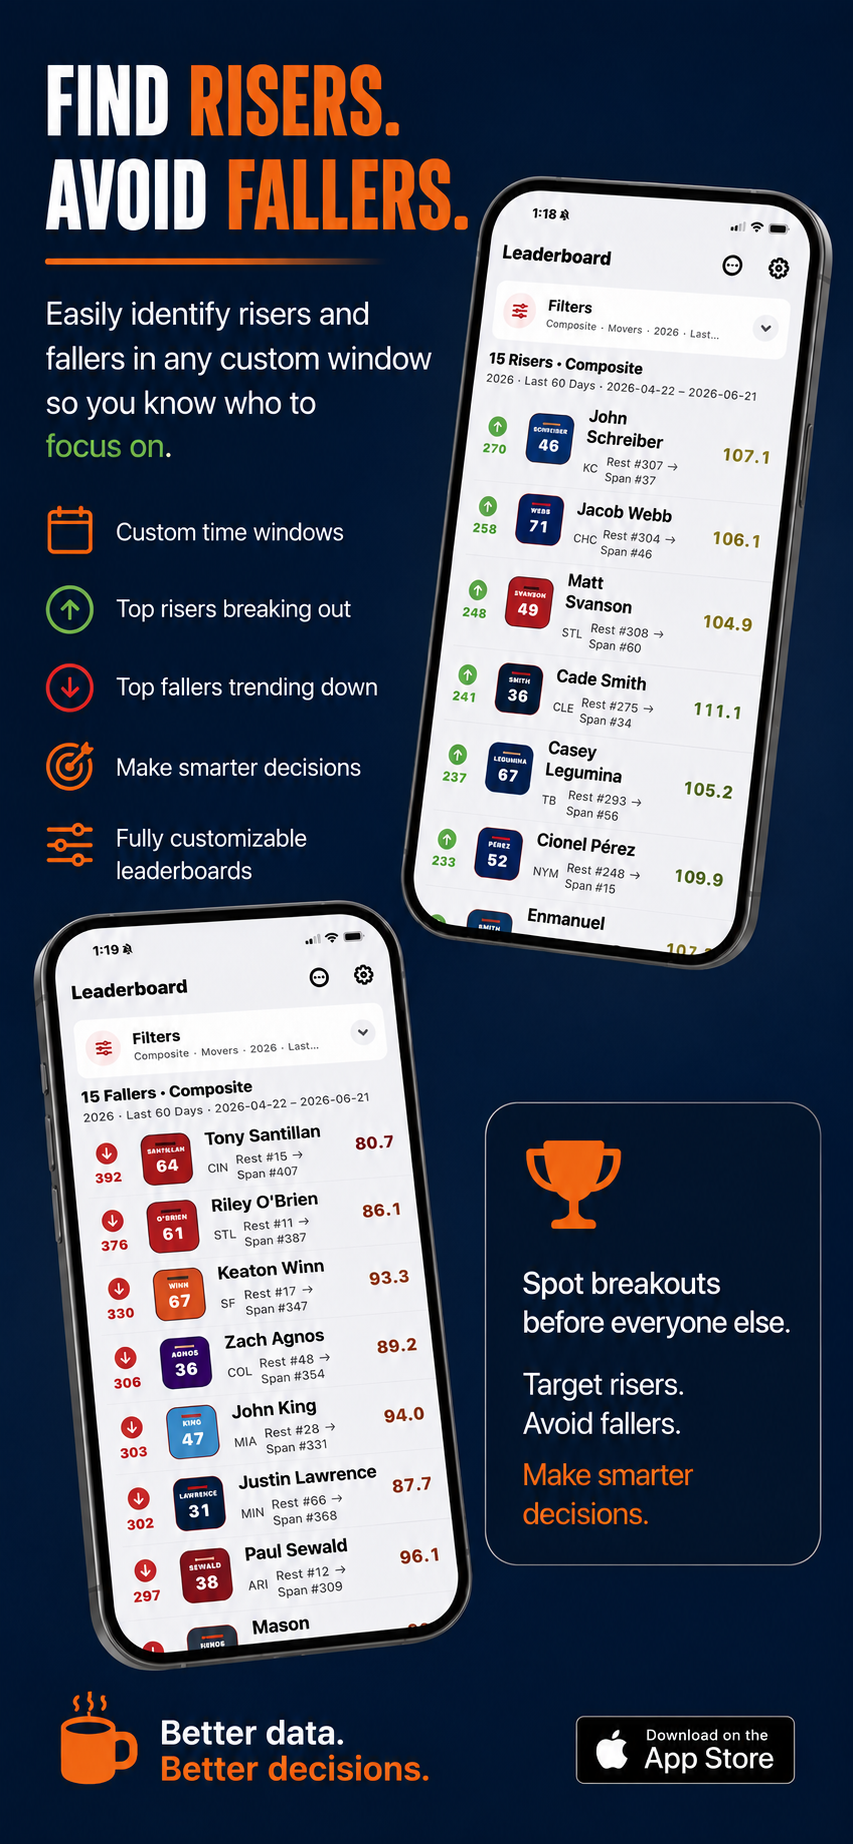
Use Composite and Movers to catch arms rising or falling in the model before the narrative catches up. Drill into a profile to see whether the move is driven by stuff, command, usage, or results.
Ask the right question
Compare Stuff+ vs. Performance+ to ask whether a pitcher is underperforming his talent, overperforming it, or changing his mix. Test it outing by outing, then export season reports as PDFs to share or keep.
Track who stays on the mound
Health, Availability, and Consistency scores track whether a pitcher is staying on the mound and delivering steady outings — not just whether his stuff plays when he's out there.
Process first.
Results second.
That's the point — and it's what makes the model predictive rather than a box-score mirror.
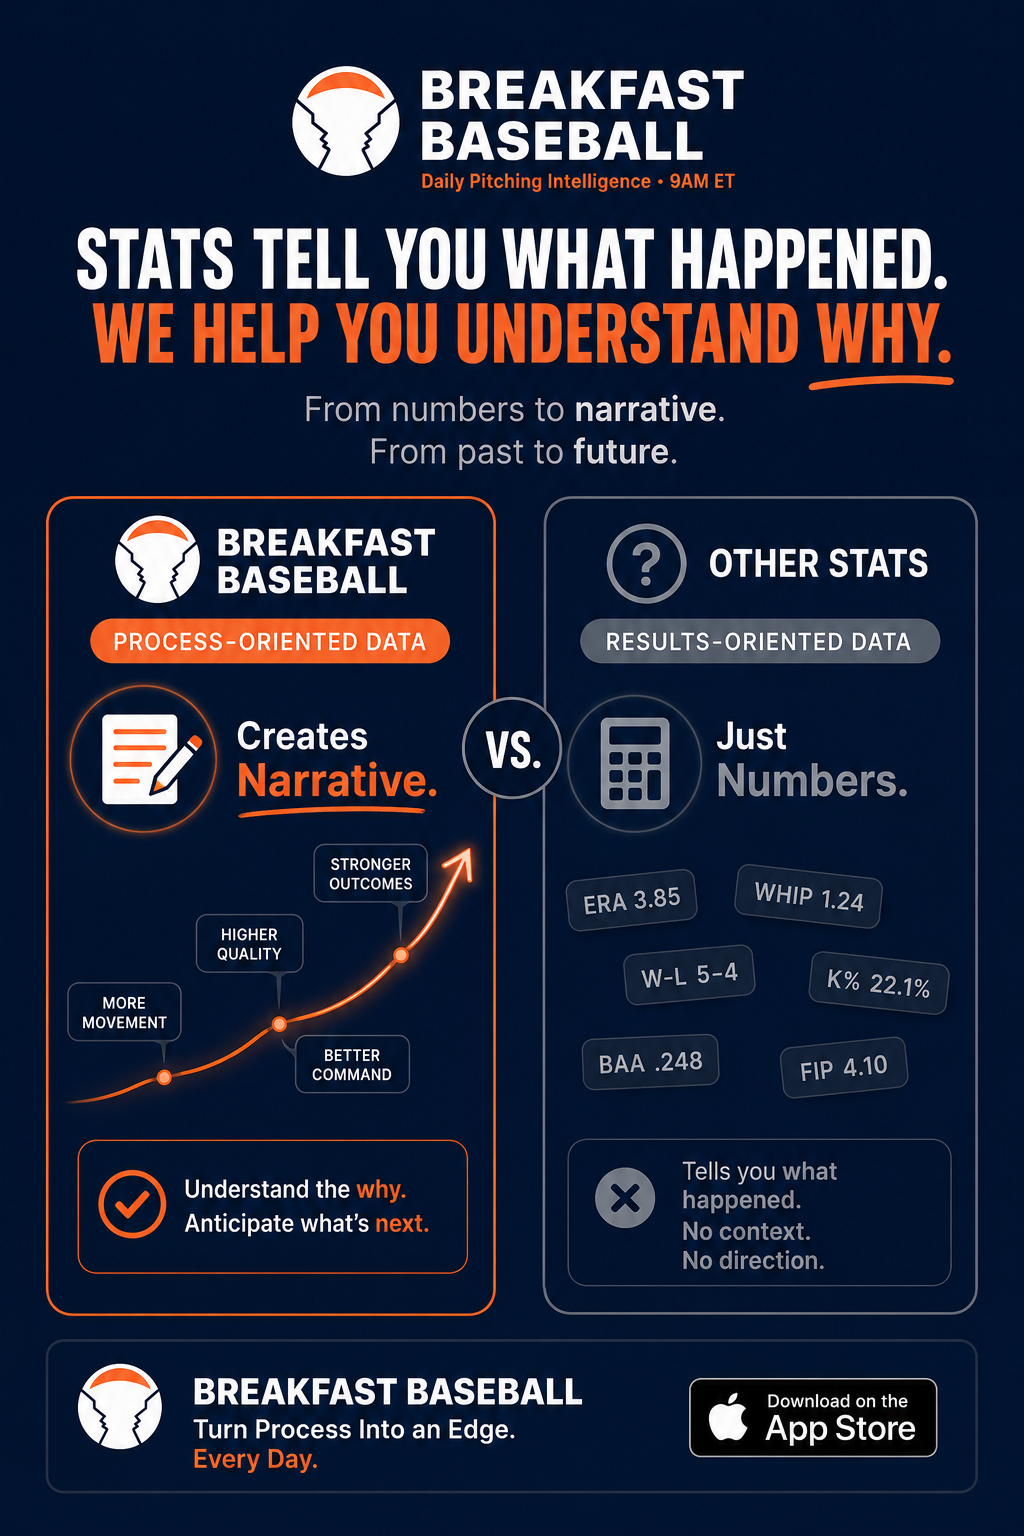
Most public pitching stats start with the box score — ERA, WHIP, even many "advanced" metrics that are still backward-looking summaries of what already happened. By the time those numbers move, the narrative has usually caught up. You're reading the past.
Breakfast Baseball is built the other way around. The core of the model is process-oriented — what the pitcher is actually doing on the mound, pitch by pitch. Stuff+ and Command+ grade raw quality and execution; Pred Stuff+ weights the pitches that matter most in tight spots. Performance+ is kept deliberately separate, as a check on the process grades rather than the headline.
When Stuff+ and Command+ run ahead of Performance+, you're looking at a pitcher whose underlying process is stronger than his recent outcomes — the profile that often precedes a breakout. When Performance+ runs ahead of the skill grades, he may be riding execution or variance that won't sustain. The app surfaces those gaps outing by outing, not just at the end of a season.
Breakfast Baseball doesn't call every start — no model does. It gives you a process-first framework for asking the right question before the consensus forms: is this arm actually throwing better, or did the results just cooperate? Is the slump real, or is the underlying stuff still there?
Numbers, turned
into a read
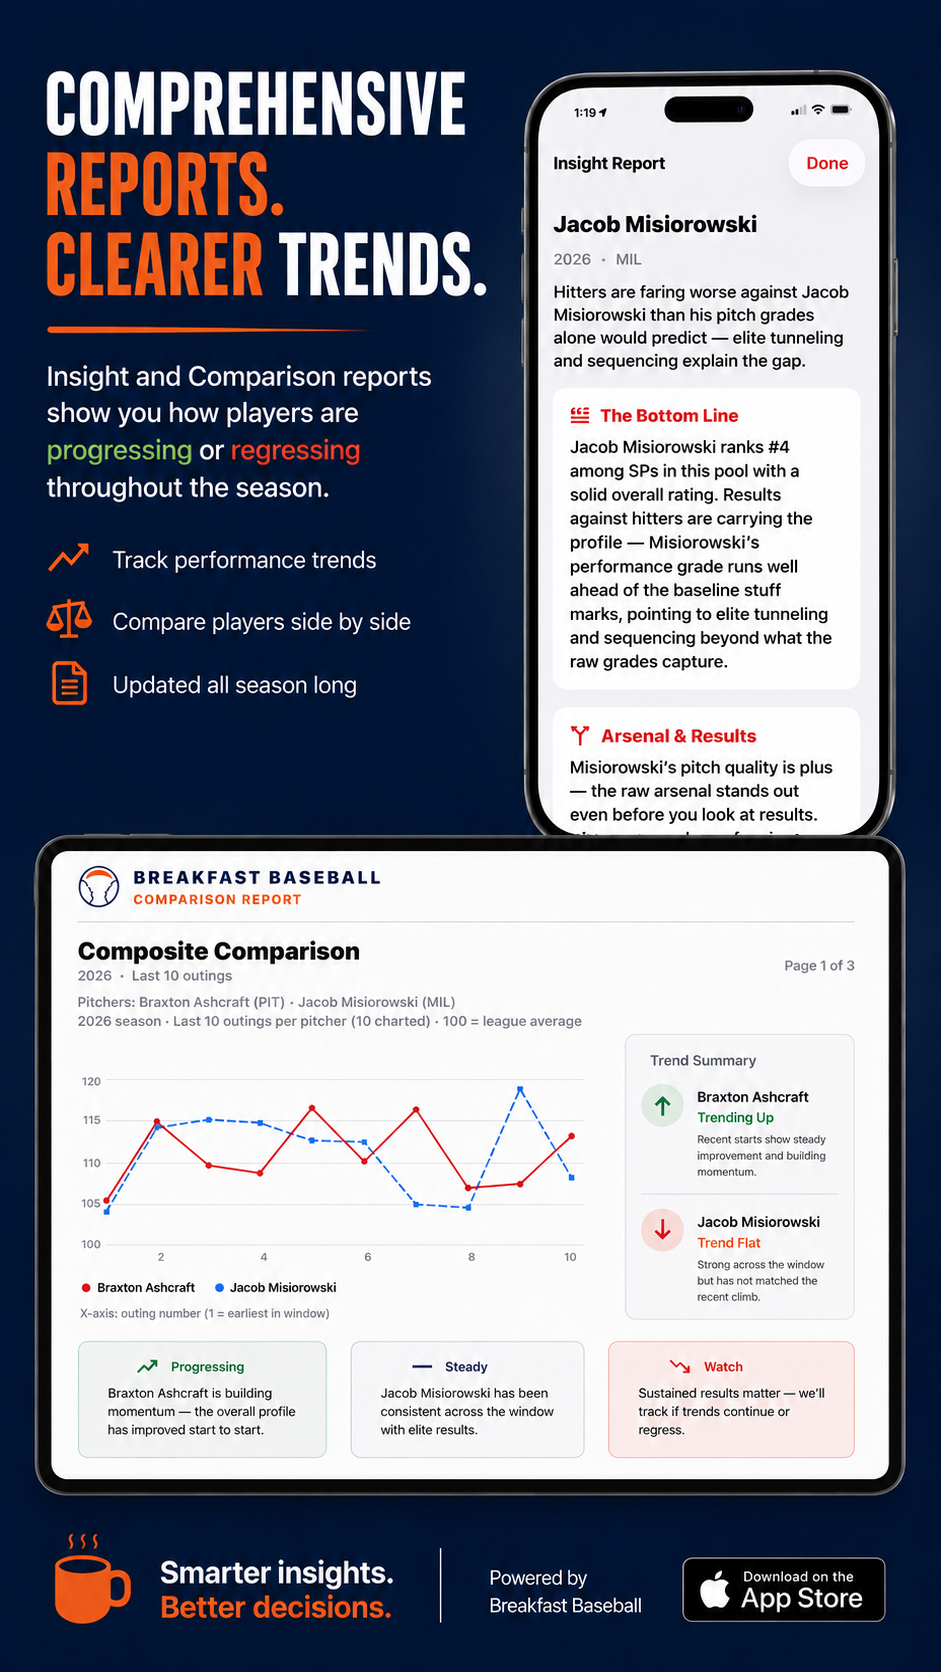
Every pitcher profile ships with an auto-generated write-up that explains what the scores mean together — where results run ahead of stuff, who's trending up, and what to watch next.
Stats tell you what happened. Breakfast Baseball helps you understand why.
Hitters are faring worse against Misiorowski than his pitch grades alone would predict — elite tunneling and sequencing explain the gap. The raw arsenal already stands out before you look at results.
Free to start. Plus when you're ready.
The daily slate, highlights, search, and current-season leaderboards are free. Plus unlocks history back to 2015, Movers, the Trend Builder, 4-way compare and more.
Good to know
{{ item.a }}
Start every day one pitch ahead.
Daily pitching intelligence, free on iPhone and iPad. Plus when you want the full model.